
Vector tiles remixed
Earlier this year I looked briefly at vector maps in the browser using the tools and services provided by Mapbox. This post delves deeper; we’ll create Mapbox Vector Tiles (MVT) without using the Mapbox stack, and for good measure we’ll use OS mapping data.
Mapbox-ing clever
Mapbox has gained a lot of followers (and paying customers I daresay) by releasing slick tools combined with a suite of hosted services that integrate together really well. And of course they have great mapping data; the global, community-driven OpenStreetMap (OSM). Most if not all Mapbox code is freely available and likewise there are open specifications for several of the fundamental parts, including the MVT specification.
As my earlier article demonstrated you are not restricted to using just OSM data. Any spatial data - so long as it’s in the Web Mercator projection - can be ingested into Mapbox. For example, it is easy to incorporate much of the open mapping data published by OS.
So if it’s so easy to work with Mapbox tools and hosted services, why would you want to do things differently?
Keep your options open
The MVT specification is open, and as a result there is a growing list of tools created by the developer community that implement the MVT spec. This gives you scope to explore alternative implementations and find the one that best suits your needs. It’s also a good way to get your hands dirty and learn about the nitty gritty of vector tiles.
In the rest of this article we will use a command line tool called Tilemaker developed by Richard Fairhurst to generate vector tiles in MVT format. It’s designed to work with OSM data extracts and does this really well without requiring any other software to be installed.
To make things more interesting we’ll use OS mapping data as an alternative to OSM.
In summary we will aim to:-
- Create some vector tiles in MVT format using Tilemaker
- Use OS mapping data as an alternative to OSM
- Generate the tiles without using any of the Mapbox stack
- Write a simple client or two to render vector tiles
Baking vector tiles
First off you don’t actually bake vector tiles but the analogy works on several levels:-
- You need to combine the right ingredients (spatial data) to create a palatable result
- You need an oven (ok, computer)
- They are bite-sized. More accurately they are byte-sized - but this isn’t the place for a protocol buffer pun.
- You can’t figure out how they were made by looking inside them.
For the terminally curious by all means do look inside one - this one perhaps. This file has a .pbf extension which stands for protocol buffer. Sometimes a .mvt extension will be used instead. Your web browser probably doesn’t know what to do with this type of file, so save it locally and open in a text editor. You’ll see something like this:
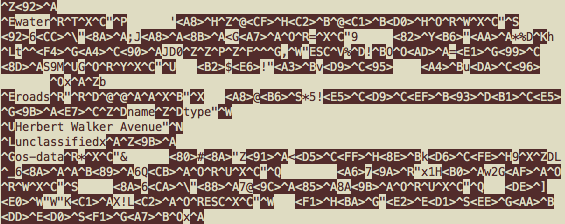
As you can see this is a binary file, though a few text strings appear as this example was created without compression. To access the content inside you need a bit of software on the client that can unpack and render it as part of a map.
What does it actually look like as a map? We’ll get to that. Basically it is up to you, using the client of your choice along with a set of instructions that define how to style the content.
Workflow
Here is an illustration of the workflow we will follow to create and render vector tiles:
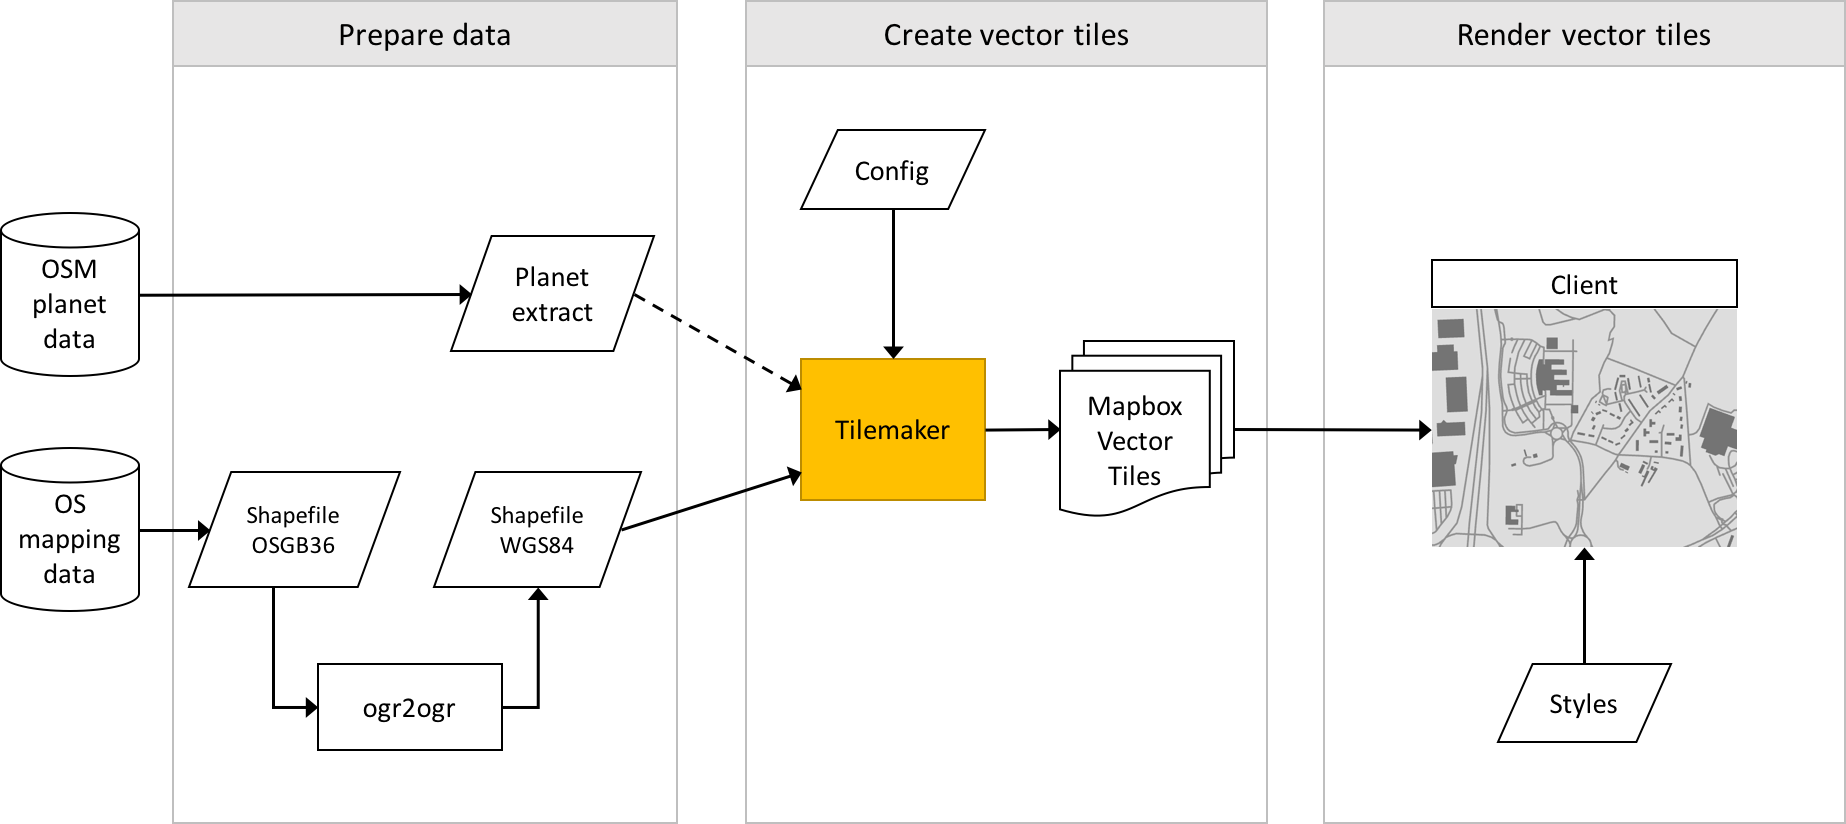
Click for a larger version.
The key to making all this work is Tilemaker. Although it is designed to work directly with OSM data extracts it can also handle Shapefiles. This means we can use OS mapping data so long as we re-project the data first.
The remainder of this post works through the following steps:
- Installing and testing Tilemaker
- Preparing some OS mapping data
- Configuring and run Tilemaker to generate our vector tiles
- Writing a simple web client to render our vector tiles
Grab a cuppa and I’ll see you back here in 10.
Install and test Tilemaker
Follow the instructions to install Tilemaker. It requires OS X, Ubuntu or Fedora. Installation on OS X is particularly easy with Homebrew.
Download an OSM data extract so you can test Tilemaker. Country and regions can be downloaded from Geofabrik, but for our purposes a city-sized extract is better. Luckily these are available from Interline as OSM Extracts.
Run Tilemaker to generate vector tiles from the OSM data extract. For example:-
tilemaker southampton.osm.pbf --output=tiles/
This uses default configuration files and should create a hierarchy of .pbf files using the familiar z/x/y layout. If all you want to do is generate vector tiles from OSM data extracts you can stop reading now and go do something else.
Prepare OS data
Download some OS mapping data in Shapefile format. You can browse all the available products but I recommend Vector Map District (VMD) or Open Map Local.
Now how have some shapefiles in OSGB36 projection (EPSG:27700). To use them in Tilemaker we need to re-project to WGS84 (EPSG:4326). This is simple using the following ‘ogr2ogr’ command:-
ogr2ogr -t_srs EPSG:4326 <destination.shp> <source.shp>
Alternatively, if you are a QGIS user you may prefer to download full-GB coverage of VMD. Add this to QGIS as a vector source (Spatialite) and from there you can export the individual layers you are interested in, re-projecting to EPSG:4326 at the same time. Here’s a screenshot from QGIS showing the tidalboundary and tidalwater layers.
Configure and run Tilemaker
To-do
Render vector tiles
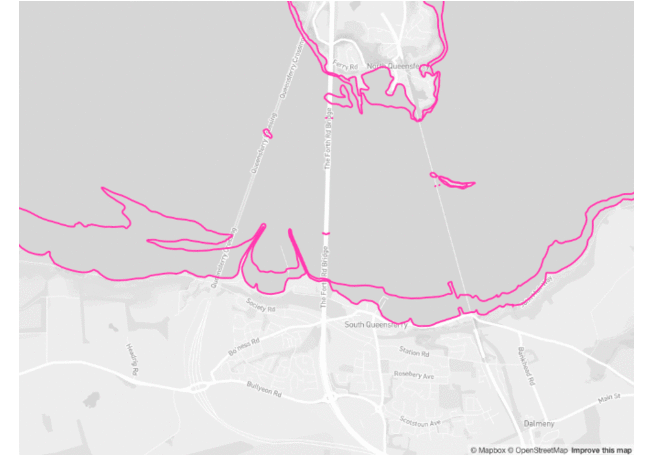
This image shows our home-baked vector tiles being rendered in different clients. One uses Tangram and is rendering roads, buildings and tidal boundaries - all pure vector data from our tiles. The other is Mapbox GL and combines a Mapbox-hosted vector map with our tidal boundaries added as a vector source. In both cases the vector tiles are being served up locally from the tiles directory created by Tilemaker.
To-do add links to code