
Vector maps in the browser
This article describes building a vector mapping demo using Mapbox tools and open data published by Ordnance Survey and Land Registry.
Today marks the launch of four new Ordnance Survey open data products and I’ll be covering all of them in future blog posts.
Acknowledgements
Mapping data comes from Ordnance Survey’s latest - and arguably greatest - addition to the family of open data mapping products. I’ve used OS Open Map - Local which gives you street-level vector data for Great Britain, though my demo only cover a smaller area around Southampton. I’ve also added INSPIRE index polygons from Land Registry.
This project is based on a great vector map from parallel which uses other products from the Ordnance Survey open data family. They have a much better handle on cartographic styling than I do.
I also benefitted from an ongoing series of vlogs by Earthware which cover loading and styling OS OpenMap Local in Mapbox Studio.
If you’re new to vector mapping and associated tools this deck from Eric Theise is a great place to start.
The resulting map looks like this:
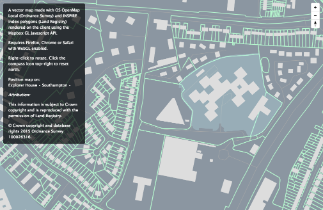
Click here to open the interactive demo
Step by step
There are quite a few moving parts involved. Here’s a summary of the steps I followed to create the demo:-
- Set-up PostgreSQL database with the PostGIS extension and all other pre-requisites. Comprehensive instructions are in the deck by Eric mentioned above.
- Download vector mapping data.
- Import vector data into PostgreSQL using
ogr2ogr. Earthware cover this in detail though the instructions refer to Windows. - Download and install Mapbox Studio.
- Download and install the Mapbox vector tile utility in PostgreSQL. This is covered in the Mapbox PostGIS manual.
- Create a custom vector source in Mapbox Studio and add layers from PostGIS. This is explained in the Mapbox documentation but I found articles from Earthware more helpful.
- Style the data then upload to Mapbox. This creates a vector tile source attached to your account. I took out a Basic subscription with Mapbox as their free 100MB account is quickly used up.
- Write a simple web page using Mapbox GL to stream your vector tiles into a WebGL-enabled browser. I adapted the existing demo by parallel to suit.
Next step
Improve map styling - there’s a lot to this but it’s all covered in the Mapbox GL styling spec.