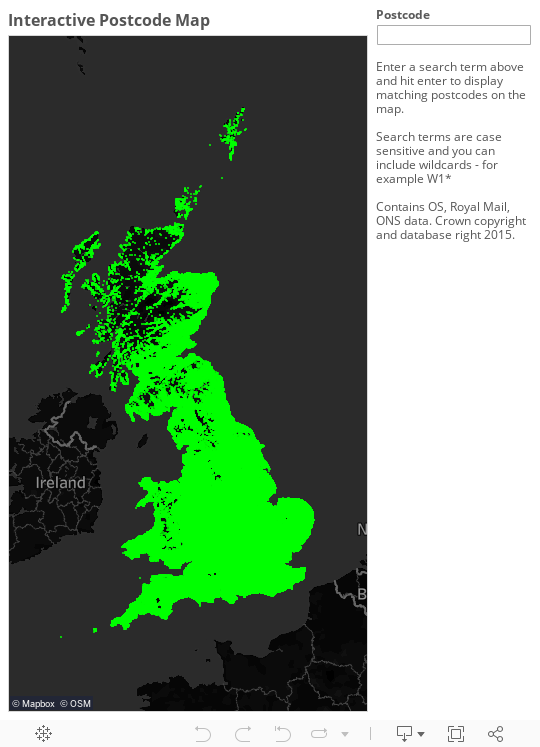
Interactive postcode map
An interactive map of 1.6 million postcodes in Great Britain using Tableau Public prompted by a tweet from Brian Timoney. I’m increasingly turning to statistical and analytical tools to manipulate and visualise large geospatial datasets, and Tableau proves very capable in this respect.
Read the background to this project or skip right to the end to see the map.
Inspiration
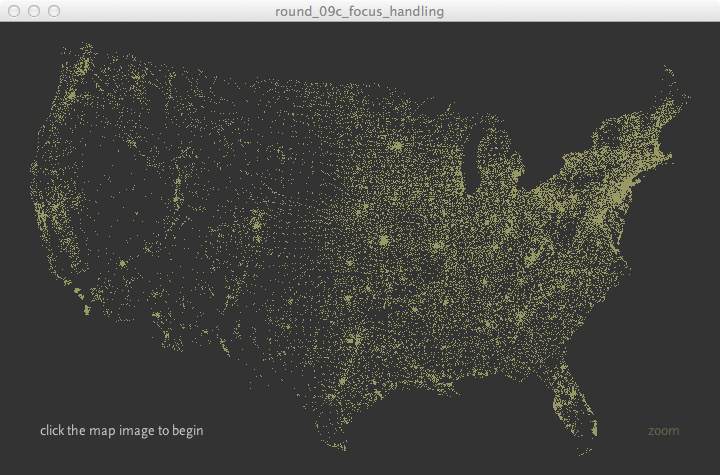
Several years ago I read Ben Fry’s book Visualizing Data and was impressed by zipdecode - an interactive zipcode tool built using Processing. It was a simple dots-on-a-map visualisation of all US zipcodes with an added "wow" factor - start typing a zipcode and the map would zoom in/out and all matching zipcodes would light up.
Perspiration
Around this time I recruited an intern into OS Labs for 6 weeks - Joseph Braybrook. He mentioned Minecraft during interview, so naturally the first task I set him was to build a Minecraft version of Great Britain. The result got some great press coverage and the story has a happy ending as Joe took on a permanent role with OS.
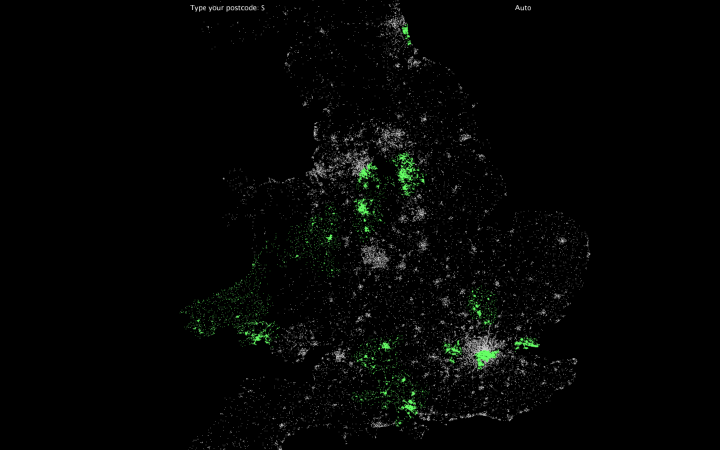
The remainder of Joe’s internship was spent re-creating zipdecode using Ordnance Survey data. This worked great as a desktop application built in Processing but performance wasn’t great and there was no chance of getting it working in a web browser.
Exasperation
In the meantime I’ve played around with a lot of geo and web code libraries, platforms and applications and the "interactive postcode map" is my favoured use case - after all, how hard can it be to build a performant web map that is capable of handling millions of features with a high degree of interactivity?
Pretty hard it turns out, especially if you have seldom-used programming muscles like me and want to see immediate results.
As a big fan of Eric Fischer I’ve got pretty into the Mapbox tools creating things like this along the way. I managed to use tippecanoe to build vector tilesets containing millions of points but couldn’t figure out how to get the interactivity I was looking for. I also have no idea how to pronounce "tippecanoe".
Next up I tried CartoDB which I’ve used successfully for lots of other map visualisation projects, which meant I hit the 50MB limit on their free plan very quickly.
Tribulation
Which brings me to Tableau. In the space of an hour I was able to sign up to Tableau Public, load up the Code-Point Open data and build a simple map view with wildcard search on postcode. There’s a generous 10GB of storage on the free tier and a polished desktop app which I downloaded on OS X.
Tableau’s map stack is by Stamen and provides a good selection of styling and content options. The only data preparation required was to transform Code-Point Open co-ordinates to web mercator using the geospatial Swiss Army knife that is ogr2ogr (other brands of geospatial utility knife are available).
Visualisation
If you read this this far, thanks for reading. Here’s the map…